
Slideshow:


Padova is a city of around 210,000 in the north-eastern part of Italy. It is the third largest provincial capital of the Veneto region, and the most densely populated (average density 2300 inhabitants/km2). The city is located 20 km west from the Venetian lagoon at the extreme north-eastern border of the Po plain. The morphology of the territory and its key position at the crossroads of the routes that connect Venice to Milan and to Bologna has fostered the development of the city.
Soil sealing is among the main issues in Padova, where 49.3% of the municipal territory is urbanized: the highest share in the region and among the highest in Italy (ISPRA, 2018). Recent urban development trends have worsened this condition, with 1337 ha of land taken for urban expansion in the last 30 years, more than in all the other cities of the region (ARPAV, 2017). The high degree of soil sealing negatively affects the environmental conditions of the city and worsen the consequences of extreme events such as heat waves, storms, and urban floods.
In this context, urban trees are a fundamental component of the urban green infrastructure and provide key ecosystem services to the citizens, especially in the most densely built-up areas. In the city there are more than 40,000 public trees managed by the municipality. All of them are mapped in a GIS database, which collects continuously-updated information about their structural features and management interventions. The municipality is interested in understanding the true potential of such database, not only for informing and directing management interventions, but also for supporting planning decisions, including the prioritization of new planting sites and the selection of suitable species to be used in different areas of the city.
The main policy questions that guided the work of the city lab are:
- How much do public trees in Padova contribute to the environmental quality and performance of the city, hence to the wellbeing of its inhabitants?
- Are ecosystem services and disservices from public trees equally distributed across the city?
- How can monitoring data collected for management purposes support a better planning and management of Padova's green infrastructure?
Key staff from the municipal department of green infrastructure and responsible for managing the tree database was involved in the city lab together with research partners from the University of Trento. Students from the University of Padova working as trainees in the department were also involved in the activities and contributed to data collection and analysis. The members of the city lab worked in close collaboration during the whole project, which allowed designing and testing the methodological approach by considering both its scientific soundness and its applicability.
At the start of the project, two main directions for activities were agreed-upon:
- integrating the existing database through the assessment of a set of relevant ecosystem services and disservices;
- carrying out a spatial analysis of the data to understand their distribution across the city.
In the first stage, some of the models available in i-Tree Eco (https://www.itreetools.org/eco/index.php) were selected to assess the provision of relevant ecosystem services. Then, the burden associated with data preparation and processing suggested the development of an alternative method, easier-to-use and directly applicable to existing data. Among the latter, based on previous studies (e.g., Vogt et al., 2017), tree species were identified as a main characteristic linked to the provision of ecosystem services and disservices, as well as to some management requirements.
A qualitative scale was defined for each of the selected ecosystem services and disservices and management requirements. Next, through a review of the scientific literature, each species was classified according to the scale. In this phase, knowledge and experience of the municipal staff proved essential to assess the transferability of data from existing studies to the specific context of Padova, and to complete the assessment for missing species. The main support from the research side was in the spatial analysis of the data and in the analysis of the results.
Table 1. Quantitative indicators calculated through i-Tree Eco for the year 2013.
| INDICATOR | MEASUREMENT UNIT |
| Pollution removal (NO2, SO2, O3, CO, PM2.5) | tonne/year |
| VOC emissions | kg/year |
| Carbon storage | tonne |
| Gross carbon sequestration | tonne/year |
| Avoided runoff (interception) | m3/year |
Table 2. Ecosystem services, disservices, and management requirements assessed through qualitative indicators based on tree species, and respective measurement scales. The use of italic indicates that some species are (still) missing in the assessment.
|
INDICATOR |
MEASUREMENT SCALE |
|
ECOSYSTEM SERVICES |
|
|
Honey plant |
yes/no |
|
Bird feeding |
yes/no |
|
Ornamental value |
low/medium/high |
|
Cooling potential |
low/medium/high |
|
ECOSYSTEM DISSERVICES |
|
|
Odor nuisance |
yes/no |
|
Potential damage by roots |
yes/no |
|
Allergenic potential |
low/medium/high |
|
Toxicity potential |
low/medium/high |
|
MAINTENANCE REQUIREMENTS |
|
|
Overall maintenance requirements |
low/medium/high |
|
Stability risk |
low/medium/high/very high |
|
Tolerance to drought |
low/medium/high |
|
Tolerance to cold temperature |
low/medium/high |
The assessment was conducted at three different scales:
- single tree: the existing database was expanded by adding for each tree (quantitative and qualitative) information about its potential to provide selected ecosystem services and disservices, as well as some key requirements for management;
- district: considering the six main districts in the city, that can be compared not only in terms of absolute number of trees and tree density, but also in terms of relative performance related to the selected ecosystem services and disservices, and the required management intensity;
- city: quantitative data for the whole city were calculated through i-Tree Eco. Moreover, both quantitative and qualitative analyses were carried out separately for street trees and trees located in public green areas.
Map 1: typologies of public urban green
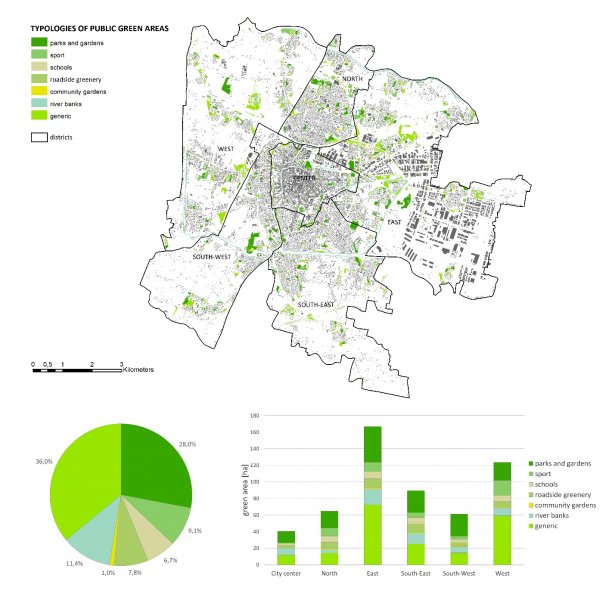
The map shows public green areas in Padova classified according to the main typologies as defined by the municipality for management purposes. The total amount of green areas is around 550 ha, which corresponds to 5.9% of the territory, 26.5 m2/inhabitant. The prevalent types are generic green (e.g., lawns and other green areas accessible to public use but not managed as urban parks) and parks and gardens. These latter represent 28% of the total amount of green areas. Among the most important green infrastructure in Padova are semi-natural areas along the river banks that surround the historical center, popular recreation places among the locals.
As it can be seen from the graph, green areas are not equally distributed among the city districts, neither in terms of quantity nor in terms of type. The most peripheral districts (i.e., East and West) are characterized by a greater availability of green areas, but the share of generic green is higher compared to the city center.
Map 2: location of public urban trees
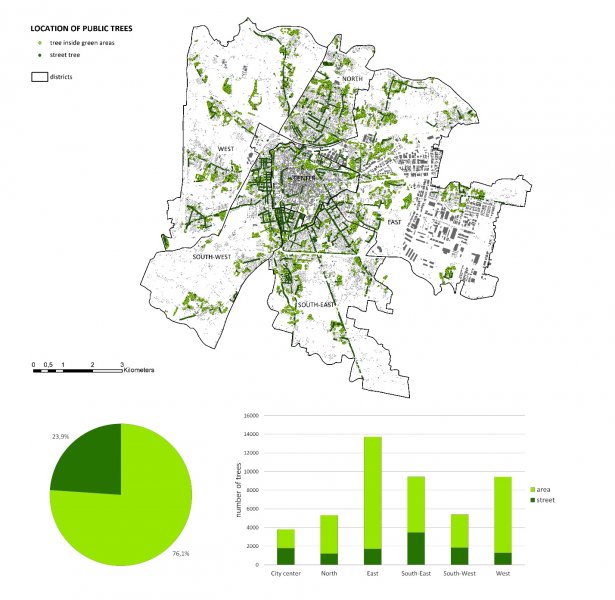
The map shows the distribution of public trees managed by the municipality. Street trees represent 24% of the total and are mostly located along the main roads that depart from the city center and in neighborhoods where the urban morphology is characterized by the presence of tree-lined streets. As a consequence, the share of street trees is higher close to the center and lower in the peripheral districts, where trees located in public green areas prevail.
The analysis conducted through i-Tree Eco for the year 2013 produced some key figures about the ecosystem services provided by public trees in Padova. Overall, they store 6554 tonnes of carbon, with a sequestration rate of 307.1 tonnes per year. During the reference year, public trees removed around 10 metric tons of air pollution, including 6.4 tonnes of ozone (O3), 2.5 tonnes of nitrogen dioxide (NO2), 0.7 tonnes of particulate matter less than 2.5 microns (PM2.5), and 0.3 tonnes of sulfur dioxide (SO2), while emissions of volatile organic compounds (precursors to ozone formation) were estimated to be around 3.9 tonnes. Trees also contribute to avoid surface run-off by intercepting stormwater and increasing infiltration and storage in the soil. In 2013 in Padova the total avoided runoff thanks to the presence of public trees was 25.7 thousand cubic meters.
Map 3: carbon sequestration
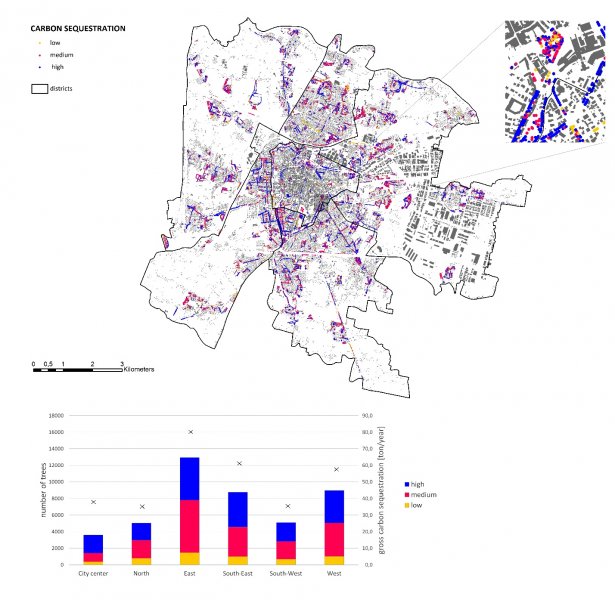
Other analyses were conducted by linking the information about the ecosystem service and disservice potential of the different species to the existing municipal database of urban trees. The map shows the results for carbon sequestration. The spatial analysis conducted through a GIS software allowed investigating the distribution of the ecosystem service across the city. As an example, the graph shows the number of trees and respective classification in the different districts. The comparison with the quantitative results calculated by i-Tree Eco served as a rough validation of the results. The city center hosts less trees than North, but more trees classified with high carbon sequestration potential. Quantitative data confirm this observation, resulting in almost 5 tonne/year less carbon sequestered in North compared to city center.
Map 4: distribution of Honey plants
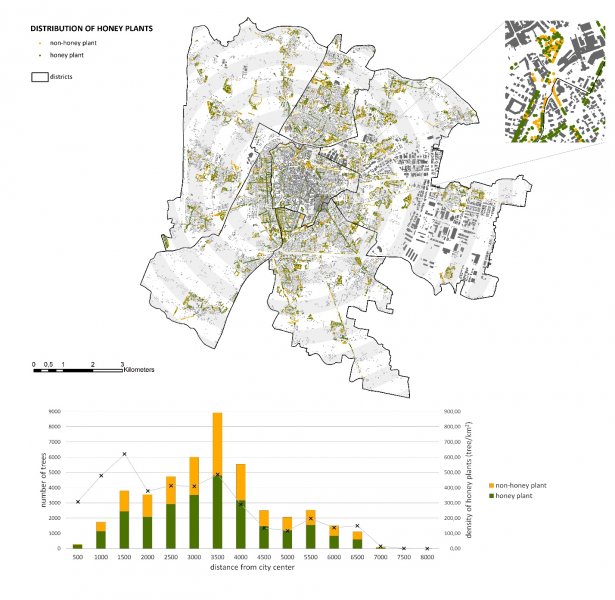
Another issue investigated by the city lab was the presence of honey plants, as shown in the map. Honey plants (or melliferous plants) are flowering species that provide nectar and pollen to honeybees for producing honey. In this case, the spatial analysis was carried out considering the distance from the city center, to capture variations in the presence of the selected ecosystem service along a gradient from the center to the periphery. Concentric buffers at a distance of 500 m have been used to divide the map in different zones. The graph shows the number of trees in each buffer and the density of honey plants (which accounts for the progressive increase of the buffer area while moving away from the city center). The density is characterized by a peak between 1500 and 2000 m from the city center, then it drops when it reaches 4500 m. The analysis points to a scarce provision in the peripheral districts, where the presence of honey plants could be useful to support honeybees and pollinators in the proximity of agricultural areas.
The overall objective of the activity in the city lab of Padova was to test the potential of the existing database of public trees for supporting decisions about the management and planning of urban green infrastructure. The results of the analysis indeed provide relevant information at the city scale, especially to compare different areas and districts and, more in general, to highlight unequal distributions of benefits, disservices, and management burdens associated to the presence of trees in the city. Potential uses of the results are:
- the identification of disadvantaged areas characterized by the scarcity of public trees in general, by a comparatively low provision of key ecosystem services, or by a comparatively high intensity of disservices and risks produced by urban trees. Such areas could be targeted by future interventions aimed at strengthening the supply of ecosystem services (e.g., achieving a more balanced performance in terms of carbon sequestration) and reducing ecosystem disservices and management requirements.
- the site-specific prioritization of tree species with certain features, to balance the provision of ecosystem services and disservices in the different parts of the city or to match specific needs and requirements of the different areas. In this case, the assessment of the present conditions of the areas could be compared with an analysis of their different levels of ecosystem service demand or sensitivity to disservices. For example, a list of priority honey plants could be compiled to support honeybees and other pollinators in areas close to agricultural fields and community gardens.
- the impact assessment of land use changes, to identify how the provision of ecosystem services is affected by the transformation.
- the design of appropriate and site-specific compensation schemes that accounts for the impacts of the proposed transformations as well as for the actual conditions and needs of the surroundings. For example, in the case of new urban developments, private developers could be asked to choose among a list of species selected by the municipality for each district or zone. Compensation schemes could be used both to promote the provision of relevant ecosystem services and to reduce disservices, e.g. by limiting the concentration of trees with allergenic potential in certain areas of the city.
The integration and spatial analysis of the existing tree database carried out by the Padova city lab demonstrated that monitoring data collected by the municipal department for management purposes can provide useful insights on the provision of ecosystem services and disservices as well as on the management requirements of urban green infrastructure. The database can become a powerful tool not only to identify and prioritize management interventions on the existing trees, but also, in a longer-term perspective, to plan for the future development of Padova urban green infrastructure. Identifying strategic goals and actions to prioritize in the different areas of the city could help to coordinate local actions, thus maximizing the effects of interventions.
The involvement in the city lab of key staff from the municipality was essential not only to conduct the analyses, where knowledge from local experts was required, but also to test the usability of the proposed methods and of the produced results. However, the inclusion of the policy perspective through the direct involvement of a policy-maker would have probably contributed to arise different questions, revealing further strengths and limitations that could help to finetune the approach. If and how much the database will become a tool that effectively supports municipal government’s decisions on Padova urban green infrastructure will largely depend on the interface that will be created with policy-makers after the end of the project.
Further information
- Both the i-Tree Eco software and the qualitative approach adopted in the analysis require high-quality and updated data that may be not available in all cities. While the complimentary weather and pollution data used to run i-Tree are now monitored almost everywhere in Europe, complete databases of public trees such as the one available in Padova are rarely present in cities. To compile and update such databases, protocols for data collection and management must be included in the routine work of the departments responsible for green infrastructure.
- The proposed approach for the qualitative analysis is just a rough approximation suitable to understand the spatial distribution of certain features. Despite more specific data about features and conditions of each single tree were available in the database (e.g., dimensional data, age, and health status, which affect ecosystem service potential and management requirements), the trees were classified only based on species. The aggregate results in terms of density (e.g., of honey plants) or average class (e.g., of carbon sequestration) can be used to compare different districts of the city, but they do not provide any information about the overall performance of an area.
- A key step in the analysis was the assessment, revision, and adjustment of classifications found in the scientific literature. Accounting for the specific conditions of the city of Padova was possible only thanks to the knowledge provided by local experts. The resulting classification of species is only partially transferable to other contexts. The same limitation also applies to the use of i-Tree Eco, where many variables should be carefully tuned to the specific context of application.
- Considering the potential uses of the results, a key limitation of the assessment is the exclusion of private areas. In the case of Padova, it is estimated that the major part of urban green infrastructure is on private land. Some experiments are ongoing to obtain information about such areas, either by directly involving the citizens in providing data or by making use of high-resolutions images and other remotely-sensed data (e.g., lidar data). This would allow for a more complete picture of the current provision of ecosystem services and disservices in the different areas, hence for a better knowledge base to support planning and management interventions.