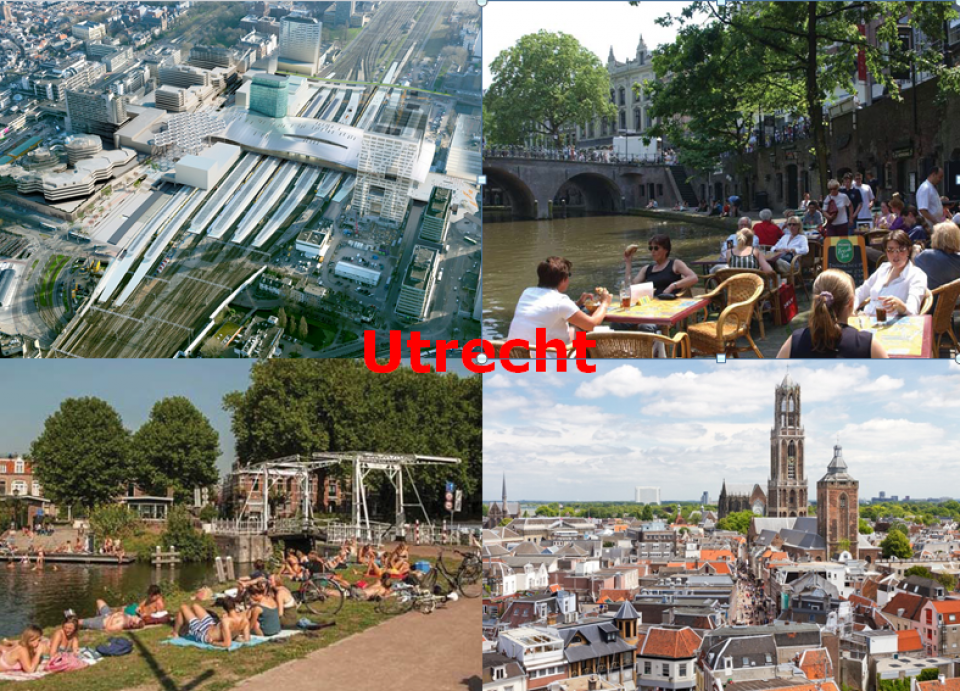
Slideshow:


Utrecht is a fast growing and compact city with green ambitions. We have to respond to the challenges that lay ahead of us. We focus on Healthy Urban Living for Everyone, for all citizens because they have to live, work and play in it every day.
Due to densification, pressure on Utrecht’s public green space is increasing. With respect to climate change and quality of life — and within its vision of healthy urban living — Utrecht aspires to optimise and utilise ‘green’ and ‘blue’ (land and water) infrastructure as much as possible both to face the consequences of climate change and to face health, sociocultural, economic and environmental challenges.
Since our city (like many others in the world) is developing rapidly, we will not only need more homes, offices, a more sustainable use of energy, comfortable public space and clean air, but also more trees and other nature based solutions.
We make green choices in improving existing public space and new city developments, for instance investing in green infrastructure by facilitating green initiatives for parks and green districts. To focus on Healthy Urban Living for Everyone, for all citizens, requires making policies that support healthy green cities for the future. This can be achieved by, for instance, combining local climate regulation, noise reduction, recreation and cleaner air.
Utrecht recognizes and utilizes the knowledge and skills of entrepreneurs, academics and citizens to develop and implement its policies. The city envisions co-creating a healthy city by thinking, learning and doing together. As a result, our city counts aready now numerous initiatives contributing to an even greener city
Growing city by densification
Utrecht is the fourth largest city in the Netherlands. It is a transport ’hub’ with highways, rivers and railways passing or transecting the city, presenting one of its biggest spatial challenges (Green Surge, 2015). In addition, Utrecht (99 km2) is the fastest growing city in the Netherlands; its population is expected to grow from 330 000 inhabitants in 2017 to 410 000 in 2030 and 430.000 in 2040. Utrecht wants to facilitate population growth within the existing city and not to build outside the current municipal boundaries. As such the nature and recreational areas around the city are spared. Since mobility remains limited, there is support for facilities and that support will be increased wherever possible. Due to densification, pressure on Utrecht’s public (green) space is increasing. How this city will be liveable and healthy is a crucial policy question for the municipality.
Life expectancy increases for everyone
We focus on Healthy Urban Living for Everyone, for all citizens because they have to live, work and play in it every day. Our objective is to reach a healthy city where also the role of public green is important.
From the Health Monitor Utrecht presented in 2014 (and now recently renewed), it appears that the health of Utrecht's citizens is generally good. This is not just for everyone. Within the city there are groups that have major health problems. The socio-economic and social-cultural position of people, including their education, plays a clear role. Thus, the neighborhood Overvecht and Noordoost, separated by a railway line, is only 12 years in life expectancy in well-experienced health! The presence of greenery has less impact on health than the use and accessibility of greenery. Good green-blue connections between residential areas and green areas are crucial when developing a healthy and intensive city. The connections must be arranged so that they challenge people to move and meet each other.In turn, this is expected to lead to more intensive use from the public outdoor space with negative consequences for green and natural values. This asks for robust design and more intensive (ecological) management of crowded areas.
Climate change
Climate change is another challenge the city has to address. Climate adaptation measures (combating long periods of drought, heat stress, flooding and water pollution) need to keep pace with climate change. An answer to this is the adoption of more green of better quality for cooling as well as the enhanced provision of facilities for recreation on and in the water.
The risk of flooding and heat stress increases in combination with increasing imperviousness of the soils in the city. This is the result of economic incentives resulting in the development of existing homes and soil sealing of gardens. Therefore excess rainwater ca no longer permeate into the soil while the chance of water pollution increase. Recent municipal research shows that since 2008 soil sealing by pavement in the municipality of Utrecht has increased by 5%.
Our aim is to make the city work as a sponge with a green and blue framework that supports ecosystem benefits. Utrecht aims to promote healthy urban living through an integrated and systemic approach that combines local climate regulation, noise reduction, recreation and cleaner air.
The general goal of EnRoute is to contribute to the improvement of green infrastructure implementation at local level. Participation of the municipality of Utrecht in the City labs of the Enroute project coincided with the policy process for the updating of the Green Structure Plan 2007. As a result, the project has had an emphatically administrative relevance for Utrecht and less a scientific one.
Participating in the Enroute city lab was an evident follow-up for Utrecht following participationin the MAES Urban pilot (2015-2016), with which we, together with scientists, mapped out various ecosystem services in Utrecht (4th MAES report on urban ecosystems).
Our policy questions are derived from the administrative assignment that we have for the updating of the Green Structure Plan, which includes GI and ecosystem services. An objective is that public green spaces need to keep pace with the growth of the city. So the questions area: how GI responds to the changing functions and more intensive use of green areas and how green measures can make the city more resilient to the consequences of climate change.
During the Enroute Citylab meetings in Malta and Tallin in 2017, and in addition to knowledge, inspiration was mainly sought to make a choice for advice on the indicators for our updated green structure plan.
The final choice of indicators is based on ecosystem services (recreation, ecology, health), and also on meeting the administrative need to control that the growth of green keeps pace with the further growth of the city.
With this indicator we can keep track annually how the growth of green per household keeps pace with the growth of the city, which means that the number of m2 green/household.
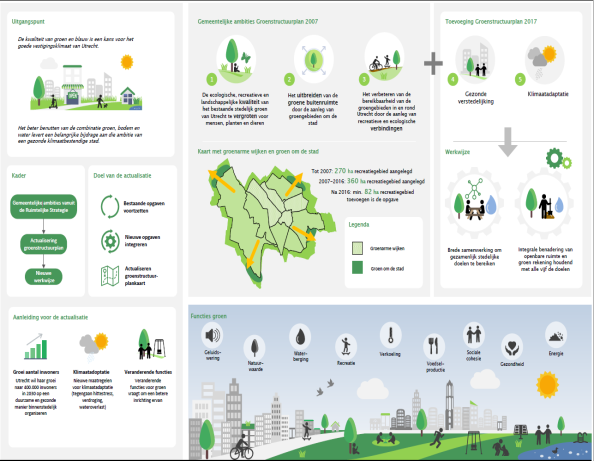
In the following (in Dutch) infographic is the content of the policy change for the update of the Green Structure Plan Utrecht made visible, started in 2016 and finally decided in March 2018.
|
Indicator |
Spatial data layers |
|
Green infrastructure |
The data are available within the municipality https://www.utrecht.nl/bestuur-en-organisatie/beleid/groenbeleid/ |
|
Accessibility of green (distance to public green) |
The necessary figures are available within the municipality, but the method to measure the indicator is still under development. The indicator is expected to be ready in 2018 (November/December). |
|
m2 of green per household |
The data are available within the municipality Source: Stadsbedrijven, City of Utrecht and www.utrecht.buurtmonitor.nl |
|
Urban heath island effect |
Available, http://kaartenutrecht-gemu.opendata.arcgis.com/. |
|
Recreation |
Data on regional level available |
|
Quality of green infrastructure |
http://kaartenutrecht-gemu.opendata.arcgis.com/ Annually we report about the projects implemented in the multiannual green program |
|
Life expectancy |
Population survey Utrecht; measurement is performed every 4 year |
|
Consumer satisfaction with public green |
Population survey Utrecht; next measurement is performed in 2018 and then repeated annually. |
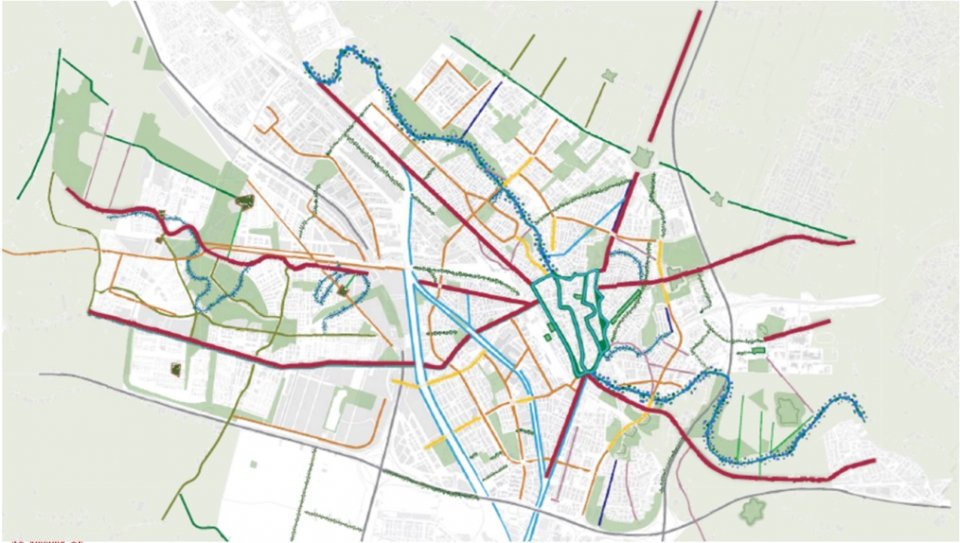
Map: Vision Green structure Utrecht 2030 (decided 8 March 2018)
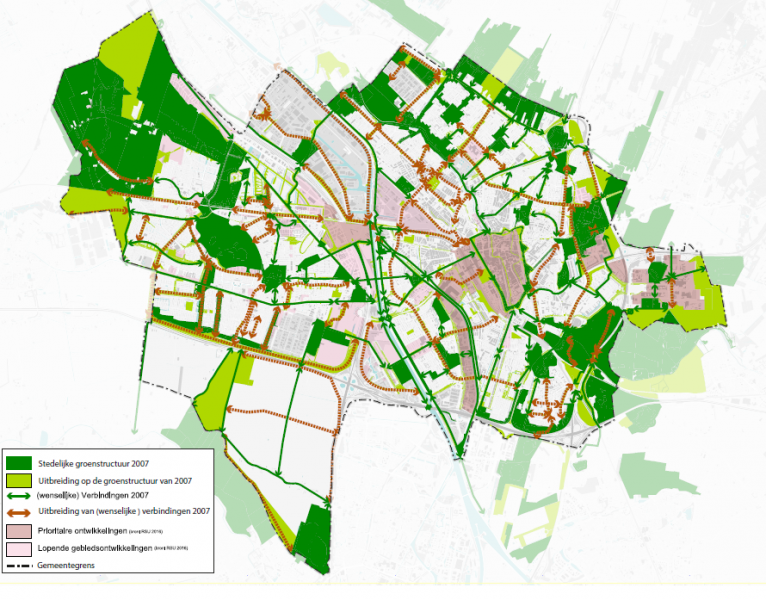
Green Structure Plan actions aim at sustainable urbanisation: less and slower traffic, climate- and energy-neutral construction, efficient water management and green areas for pleasant and healthy urban living. Utrecht wants to be a city where a healthy living environment and sustainable growth are core values. The updated Green Structure Plan 2017-2030 aims at making better use of green and blue infrastructure and restoring ecosystems. For instance, the role of trees in improving air quality, reducing urban heat island effect, and capturing CO2; or the positive influence of living nature for a healthier city, are some of the benefits foreseen by the Plan (UGSP, 2017).
Urban green is also an important theme in the Global Goals. The aim of the Global Goals is inclusive and sustainable urbanization, among other things by utilizing the opportunities for participative, integrated and sustainable urban development and management
Map Tree structure plan 2009
Another key to boosting green space is the 2009 tree policy. This explains how the city uses trees in urban development. Trees are considered to have their own spatial dimension and problems that merit specific policy on such matters as tree structure, instruments, and guidelines for their management and maintenance (Green Surge, 2015). This is based on the ecological, recreational, cultural-historic and spatial values of urban green space in and around the city.
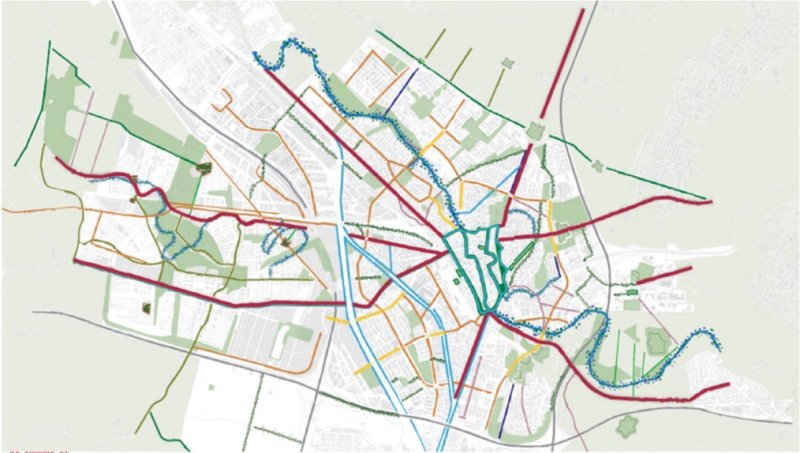
Tree map for the city of Utrecht. Source: city of Utrecht (decided 2009)
Distribution of satisfaction about greenery close by (Utrecht Monitor 2018)
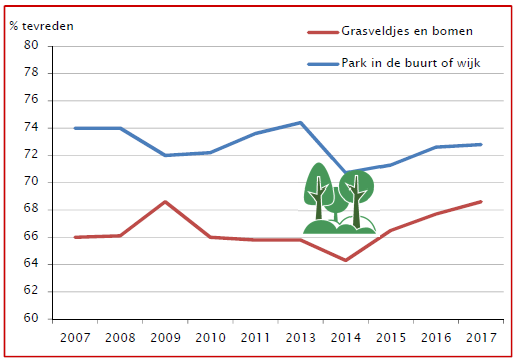
Source: Inwonersenquete gemeente Utrecht (utrecht monitor); % tevreden means % satisfied
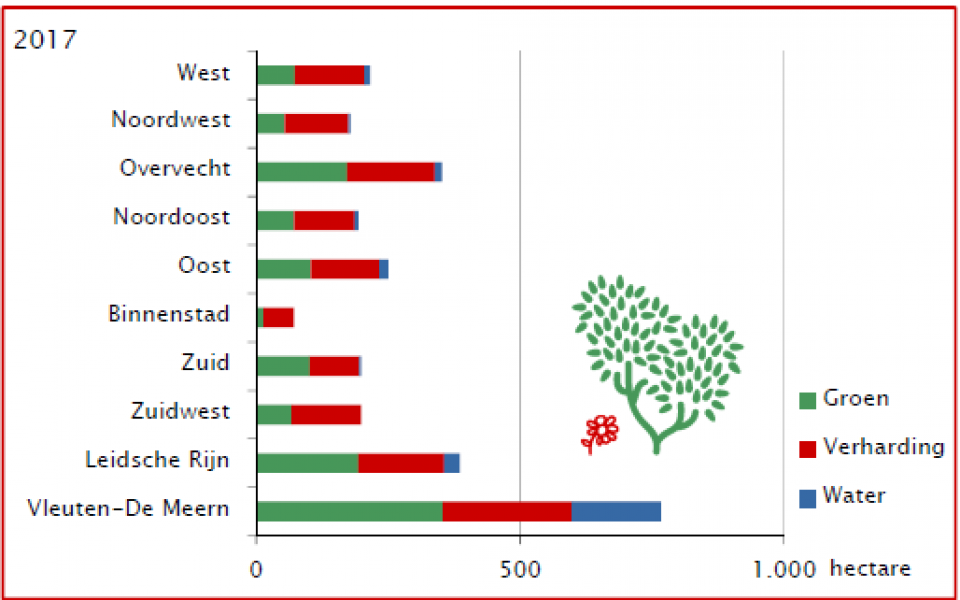
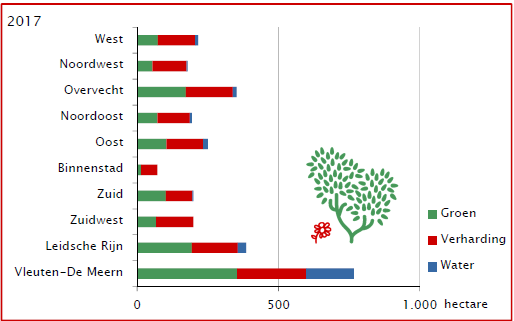
Compaction (ratio of stone and green)
The number of hectares of municipal green space in the public space per district varies greatly between the various districts in Utrecht. The inner city has the least green (14 hectares) with a dense development. In Vleuten-De Meern, Overvecht and Leidsche Rijn is green, but these districts have
also many hectares of hard or built surface. The municipality of Utrecht has a total of 1.206 hectares of green (43%), 1.357 hectares of built surface (48%) and 252 hectares of water (9%) under management. This concerns green, water and pavement in the public space and in the management of the municipality. In addition, the municipality manages 125 hectares of public space on the estates, 91 hectares of cultural-historical greenery (such as park forest, hayfield and orchards), 27 hectares of water and 7 hectares of pavement.
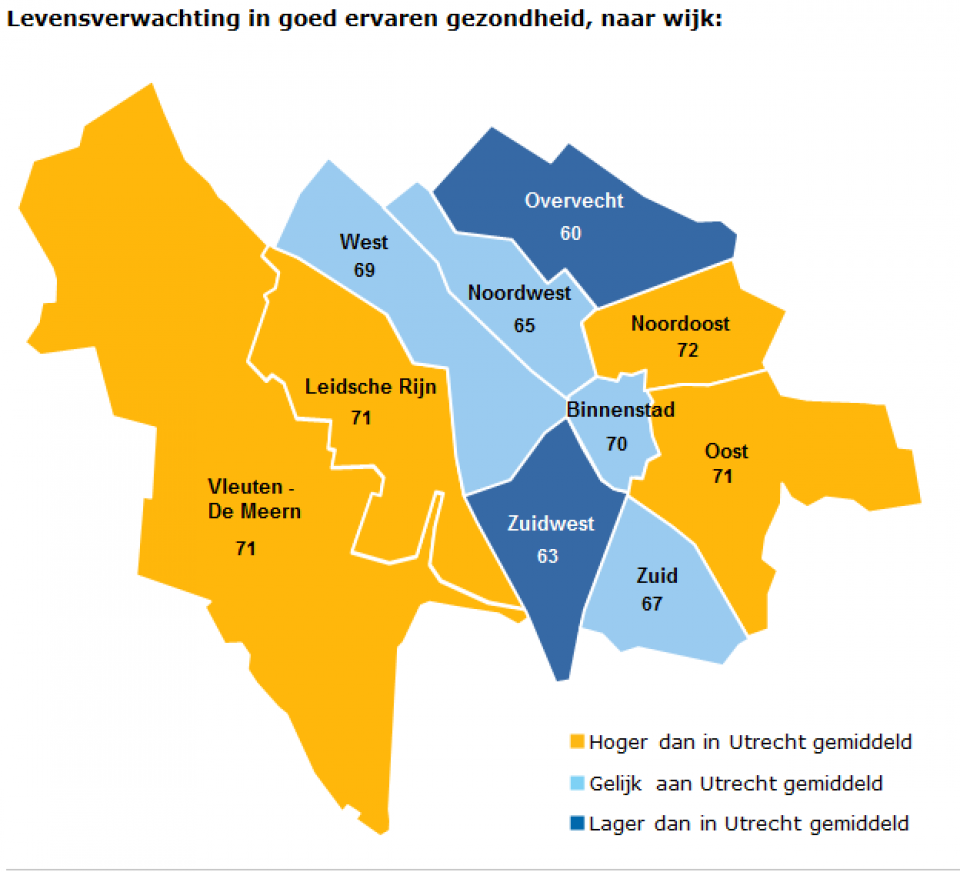
Life expectancy differs (Utrecht Healthmonitor)
The districts Overvecht and Zuidwest score worst in terms of health (life expectancy). What about health experience / well-being in relation to green? Social factors appear to have a greater impact on health than green. The presence of greenery has less impact on health than the use and accessibility of greenery. Thus, the neighborhood Overvecht and Noordoost, separated by a railway line, differ as much as 12 years in life expectancy.

In our recently updated Green Structure Plan 2017-2030 we want to ensure that the development of green keeps pace with the growth of the city and anticipates changed functions and more intensive use of green. Moreover, green plays an important role in making the city more resilient to the consequences of climate change and increases healthy urban living. We achieve these new tasks by efficient and multifunctional use of space and by using nature for the ecological, economic and social quality of the city. Mapping and assessment of green infrastructure and its ecosystem services are essential to manage urban green spaces in the city.
More knowledge about ecosystem services and Nature Based Solutions is necessary to provide opportunities for mainstreaming nature and biodiversity in projects and developments. Cities can play a role in conserving species. Urban biodiversity is becoming increasingly important to bring people in contact with nature.
Utrecht is experimenting on a national level via the Citydeal 'Values of green and blue' together with other cities with the TEEB city tool and the Atlas of Natural Capital (RIVM) to improve the implementation of green infrastructure and ecosystem services in urban planning.
One of the challenges is the development of key statistics. For example, how much volume of tree crowns do you need to get one degree of cooling? How much green should there be on the roofs? And how do we deal with that knowledge in our plans?
European Green Week 2018
In 2018 Utrecht hosted together with our partner Planbureau voor de Leefomgeving the EU Green Week to inspire and to be inspired by cities all over Europe and the world.
Our mayor Jan van Zanen adressed all participants with the next words:
“we will not only need more homes,
offices, a more sustainable use of energy,
comfortable public space
and clean air are needed,
but also more trees
and other nature based solutions.
Maybe those 160 thousand trees,
adding pleasure to our lives,
also serve as a source of inspiration.”
The EnRoute project provides recommendations for EU policy on green infrastructure and how to work together between different policy levels in the context of the urban agenda. The city labs provide knowledge exchange and contribute to the improvement of green infrastructure, ecosystems and
The EnRoute city lab was for our city a useful opportunity to share knowledge with other cities about using ecosystem services in green infrastructure planning.
The EnRoute city lab created an opportunity to better communicate the benefits from urban green space for recreation; however, more efforts and success stories are needed to convince the planning department from the added value of a natural capital approach.
There is still insufficient knowledge among stakeholders (municipalities, developers, residents) about the possibilities of ecosystems and biodiversity in urban planning.
In the city we build experience with projects like the sustainable (closed) water system of Leidsche Rijn district, city lab Smart Sustainable District (station area) and ‘Wonderwoods (building with 360 trees on it)’. There should be more support for cities to do more (scaling up these kind of experiments);
High quality and high resolution data sets on the state and distribution of urban green space are necessary to advice the city when taking decisions on urban planning. We recommend investing from the start of the project in data collection together with Utrecht University (EU Horizon 2020 project Naturvation) and WUR.
We hope that in the nearby future that our data and modelling approach is based on remote sensing data so that it can therefore be applied to any city in Europe (this is hopefully realised by the end of 2019).
Our data modelling is still in working progress with Wageningen University Research (WUR).