Slideshow:


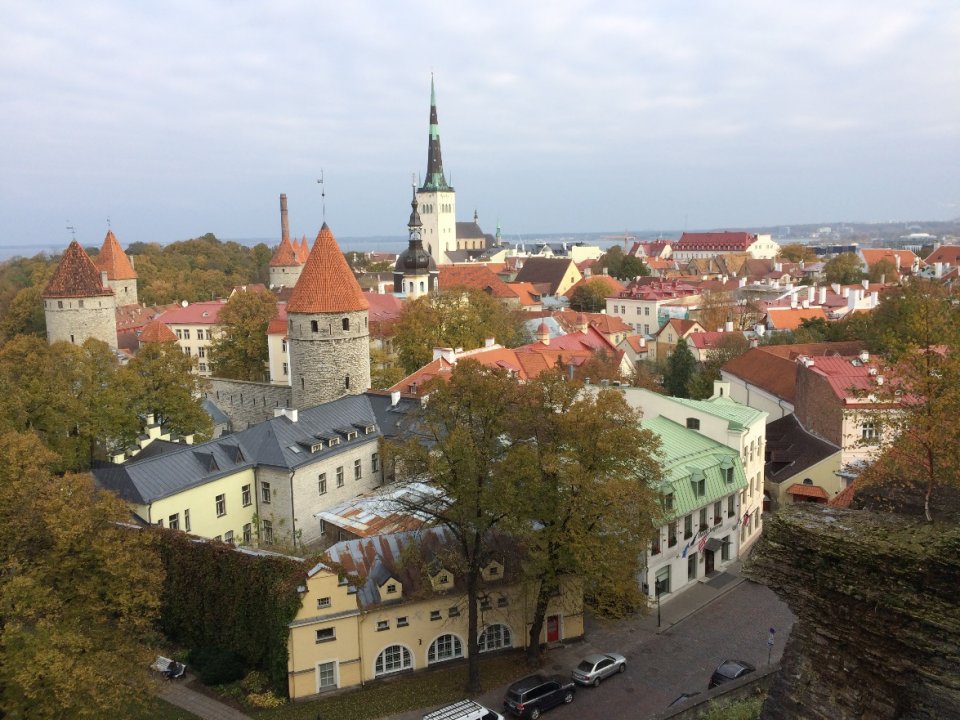
Tallinn is the capital of Estonia and with a population of 451209 people as of 1 September 2018 (Tallinn citizens’ census, 2018 - Tallinn citizens’census, https://www.tallinn.ee/est/Tallinna-elanike-arv). Tallinn is the largest city in Estonia, inhabiting 34.2% of the total population[1]. Tallinn is situated on the coast of the Gulf of Finland of the Baltic Sea and covers a territory of 159.37 km2
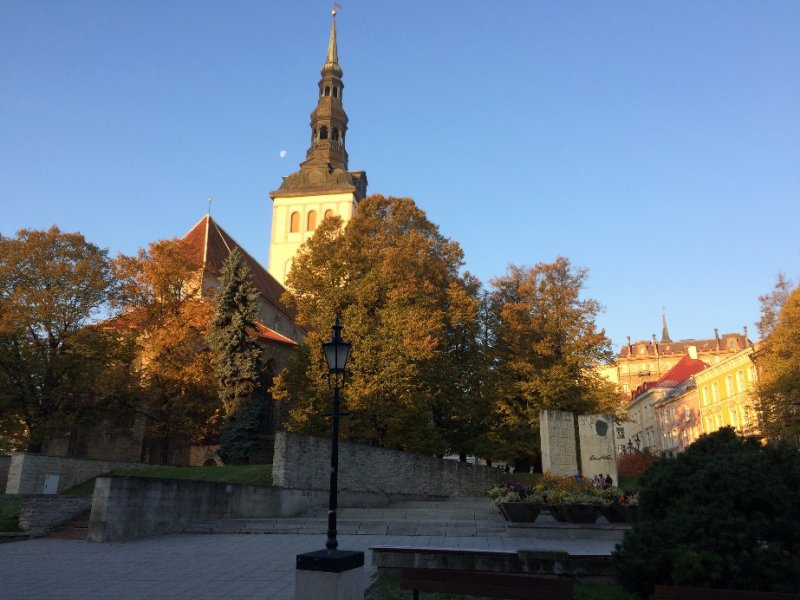
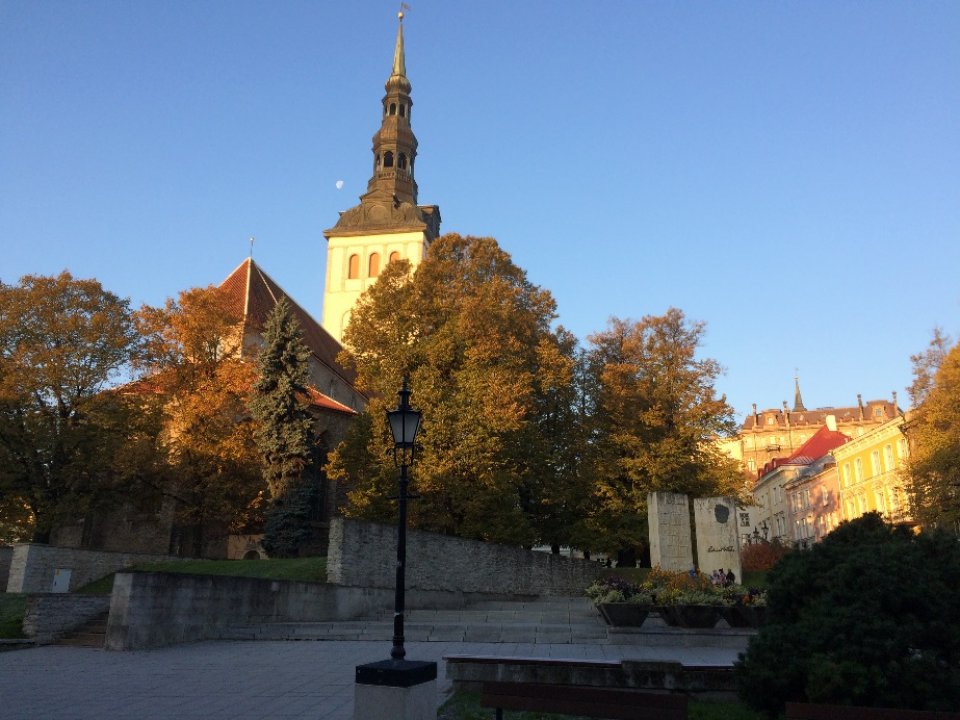
Figure 1: Old town view of Tallinn (Photo by K. Peterson)
Tallinn has a very rich landscape and nature where plants and animals that have become rare elsewhere in Europe can still be encountered here. The biological diversity of Tallinn is based on its location on the coast of the Baltic Sea, the diversity of landscapes (cliffs, coast, dunes, forests, alvars, meadows, bogs, freshwater bodies, etc.) and the mosaic nature of habitats this has created.
Figure 2: Birdwatching tower in Paljassaare SPA, a Natura 2000 site in Tallinn (Photo by K. Peterson)
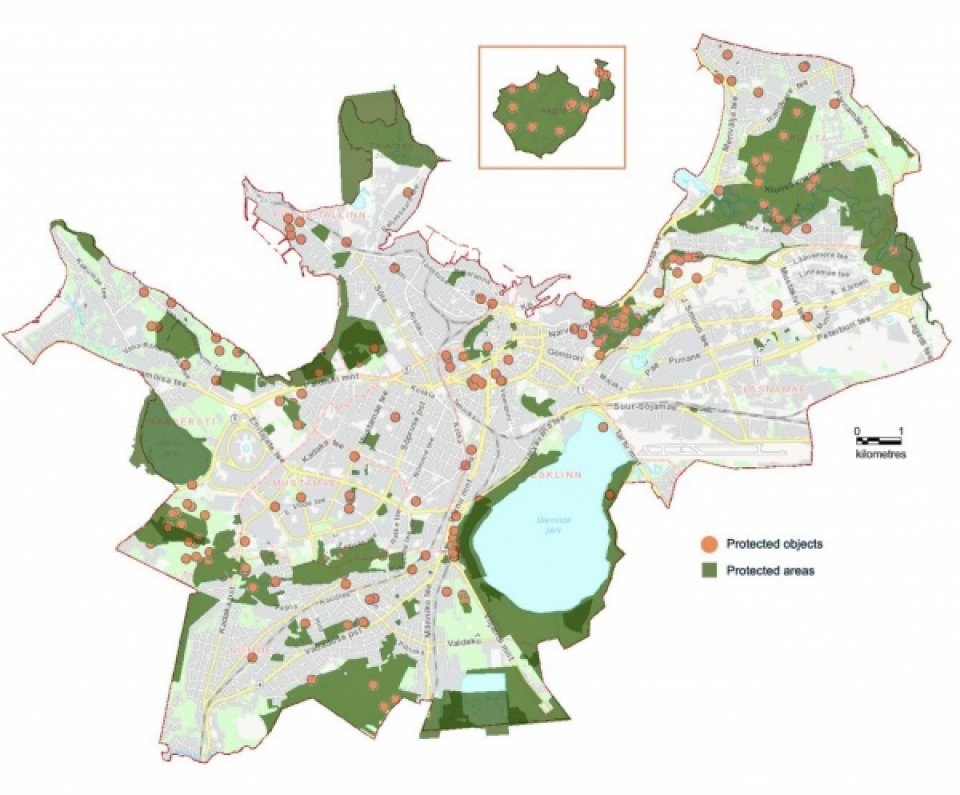
Many large ecologically functioning green urban areas have been preserved in Tallinn which serve as migration corridors for various species (birds, bats, pollinators). Protected areas cover 13.8% of the territory of Tallinn, extending to 2200ha ( Facts about Tallinn, August 2018, https://www.tallinn.ee/est/g19961s113195) (Map1.1.).
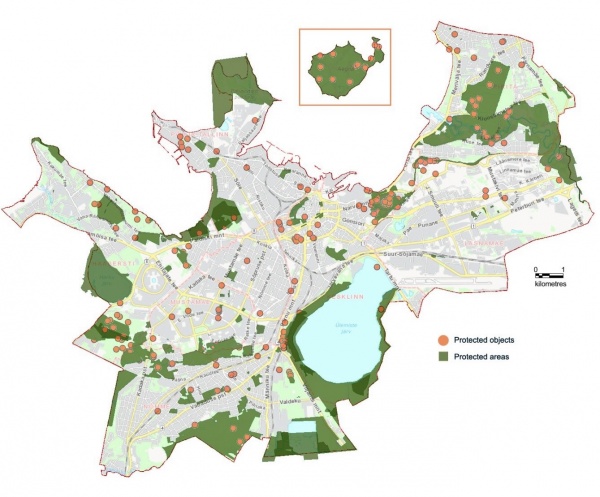
Map 1: Protected areas and objects in Tallinn. Source: Tallinn city, 2018 (https://www.tallinn.ee/est/keskkond/Kaitstavad-alad)
Climate change and Tallinn
 Tallinn, like any other city, needs to adapt to climate change and remain a liveable city for its growing population. The main adaptation issues that Tallinn needs to tackle are stemming from increasingly frequent extremes in temperature and especially short-term heavy precipitation (rain, snow).
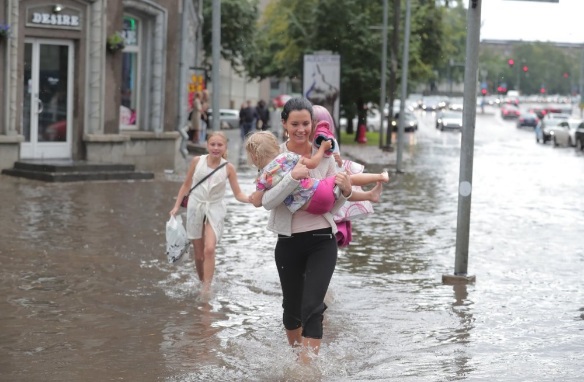
Figure 2: Accidental short-term rainfall in Tallinn. Source: Delfi.ee, 10 July 2017 (http://www.delfi.ee/news/paevauudised/eesti/suur-vihmablogi-tallinn-toib...)
Planning decisions on different levels can both facilitate and hamper the adaptation. Tallinn has implemented comprehensive spatial plans for each of the city districts, which set the minimum percentage of permeable land for each land use polygon.
The main policy question is how does the full implementation of comprehensive spatial plans of Tallinn districts (8) affect the provision of certain ecosystem services (water flow and runoff mitigation, temperature regulation, accessibility to public green areas) and the status of certain condition indicators, such as canopy cover and surface permeability.
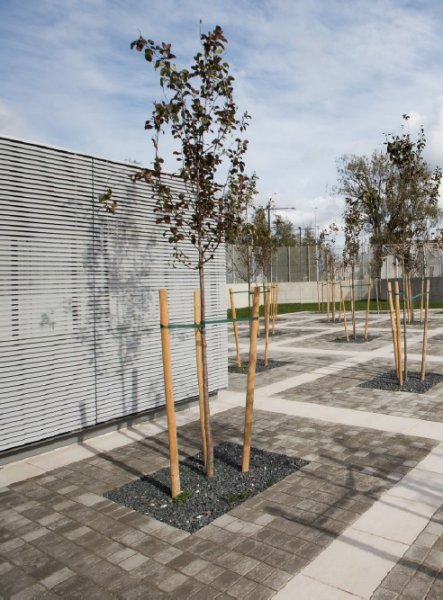
Figure 3: Example of low surface permeability in Tallinn. Source: H. Rudi, Postimees, 19 Sept 2018 (https://tallinn.postimees.ee/6408236/galerii-eesti-koige-turvatumad-euro...)
The questions will be answered in 4 steps.
- Polygonisation. A map of urban biotopes (land use types) of Tallinn is combined. It is based on the thematic land use maps of general plans of each city district.
- Mapping the present situation. Maps of surface permeability and canopy overlay cover are used to calculate the respective percentages in each land use polygon. A qualitative assessment matrix for ecosystem services (temperature regulation, water flow and runoff mitigation, accessibility to green areas) is developed and each polygon is graded. Maps of present ecosystem service capacity values are produced.
- Mapping the future situation (scenarios). Maps of condition indicator values in polygons and ecosystem service capacity values in polygons are produced.
- Mapping the changes. Maps are produced depicting the changes at polygon level where ecosystem service capacity would increase, decrease and be stable in the future compared with the current situation.
[1] Estonian population was 1’319’133 people as of 1 January 2018, https://www.stat.ee/pressiteade-2018-050
The following sources and data have been used to map and assess the resilience of the city to climate change:
Tallinn ortophoto: due May 5th, 2017.
Tallinn City TAR (spatial register of Tallinn): due May 12th, 2017.
LiDAR-based vegetation elevation model of Tallinn (10x10m): representing data from April 2016.
Tallinn territory: 15931 ha
No of Tallinn citizens: 427201 people, as of 1.01.2018 (The Tallinn citizens’ census data, Population Register)
Map polygons: 2653 in total. Land use polygons from district comprehensive plans and in the case of the city centre land use polygons from the Tallinn comprehensive plan.
Tallinn comprehensive plan, enforced on January 11th, 2001
District (8) comprehensive plans, enforced (date of enforcement) as follows:
|
District comprehensive plans |
date of enforcement |
|
1.Haabersti District: |
20.04.2017 |
|
2.Kesklinn (City Centre) District): |
has not been approved nor enforced * |
|
3.Kristiine District: |
03.11.2016 |
|
4a.Lasnamäe District residential areas: |
21.10.2010 |
|
4b.Lasnamäe District industrial areas: |
01.10.2015 |
|
5.Mustamäe District: |
26.06.2006 |
|
6.Nõmme District: |
has been approved, but not yet enforced |
|
7.Pirita District: |
17.09.2009 |
|
8.Põhja-Tallinn (North-Tallinn) District: |
has not been approved nor enforced |
*Thematic plan of green areas in Tallinn and Tallinn comprehensive plan was used instead.
In the Tallinn case study, the current and future resilience to climate change has been addressed. The resilience to climate change has been looked at via three key indicators:
- Surface permeability
- Canopy cover (overlay)
- Access to public green areas in 250 m distance from residence
These indicators have been selected based on literature review. The literature review suggested that since the urban landscapes are largely characterised by impermeable surfaces, the extreme precipitation (rainfall or snowfall) in cities results in flooding of large areas and congestion of sewers and eventually affects the wellbeing of citizens. Since the climate scenarios predict the growing frequency of such extreme weather events, the surface permeability was chosen as the key indicator for climate resilience in Tallinn city.
The literature review also suggested that parks and forests in cities provide many fold ecosystems services, such as cooling effect in extreme heat wave periods, but also buffering effect of extreme rainfall occasions. In the latter case, the canopy of trees decelerates stormwater before hitting the ground and thus buffers the flow to rainwater collectors ensuring smoother infiltration to the ground. The literature also indicates that not just the canopy of a single tree but the canopy overlay share of several trees is an important factor, thus the latter was chosen for the second key indicator for measuring climate resilience in Tallinn city.
Thirdly, public access to green areas was selected as a key indicator. Usually, the 300 m, 350 m or 500 m radius is referred to in literature. In this study the 250 m radius is suggested to scrutinize the access to public green areas closer to the citizens’ residence and thus to ensure that citizens have elevated wellbeing in terms of benefitting from cultural ecosystem services and climate resilience services that urban green areas provide.
In the following chapters the key results are described. Firstly, the literature review per each of the key assessment indicator is provided. Secondly the current situation in all three assessment areas (surface permeability, canopy overlay and public access to green areas) in Tallinn city is mapped and thirdly the possible future scenarios are put on map. The sources of data and the application of mapping methodology used to develop the contemporary and future situations are described.
Finally, conclusions are drawn and policy recommendations are made.
Surface Permeability
Surface permeability is regarded as one of the key indicators of climate resilience.
Two time scales have been selected for assessing the surface permeability in the city of Tallinn: current situation (contemporary permeability) and future permeability. It was assumed that greenery areas have good surface permeability and that greenery ratios (percentage of greenery set for each land use type in district comprehensive plans) are equivalent to such permeability.
Contemporary permeability
Base map: Land cover layer of Tallinn City TAR
Methodology: Different surface types in Tallinn City TAR were divided into two groups:
- Permeable surfaces:
- Wood
- Flintstone
- Gravel
- Sand
- Cobblestone
- Soil
- Limestone
- Artificial lawn
- Impermeable surfaces:
- Asphalt
- Concrete
- Rubber
- Tar paper
The percentage of permeable surface of each map polygon was calculated. The percentages were classified into four classes: Class 0: 0-10% permeability (in red colour), Class 1: 11-40% (in orange), Class 2: 41-70% (in yellow) and Class 3: 71-100% (in green) and represented on the map.
Summary of the contemporary map (2653 polygons in total):
Class 0 – 103 polygons, 4% (in red)
Class 1 – 395 polygons, 15% (in orange)
Class 2 – 779 polygons, 29% (in yellow)
Class 3 – 1376 polygons, 52% (in green)
Currently, the lowest share of surface permeability (Class 0 and Class 1) covers about 20% of the polygons, while more than half of the polygons has the maximum share of permeability (Class 3) (Table 1 and 4).
Table 1. Current surface permeability in Tallinn districts
|
District |
Area (ha)/ Permeability cover class |
||||
|
Class 0: 0-10% |
Class 1: 11-40% |
Class 2: 41-70% |
Class 3: 71-100% |
Total |
|
|
Haabersti |
12 |
39 |
406 |
1599 |
2056 |
|
Kesklinn |
78 |
560 |
317 |
1180 |
2135 |
|
Kristiine |
19 |
158 |
386 |
196 |
759 |
|
Lasnamäe |
26 |
663 |
951 |
1084 |
2724 |
|
Mustamäe |
18 |
158 |
487 |
138 |
801 |
|
Nõmme |
29 |
190 |
433 |
2109 |
2761 |
|
Pirita |
1 |
58 |
233 |
1539 |
1831 |
|
Põhja-Tallinn |
43 |
334 |
615 |
464 |
1456 |
|
Total |
226 |
2160 |
3828 |
8310 |
14524 |
Future permeability
Base map: Land use maps of 7 district comprehensive plans. In the case of City Centre District (Kesklinn) the thematic plan of green areas in Tallinn was used.
Methodology: Planned greenery ratios per land use type for each map polygon were taken from the district comprehensive plans and assumed to represent future permeability in each polygon. Comprehensive plans of 8 city districts, where the greenery ratio is set as follows:
Table 2. Proposed greenery ratios per land use type in district comprehensive plans in Tallinn
|
District |
Land use type |
Proposed greenery ratio |
|---|---|---|
|
Haabersti |
Forest town |
50% |
|
Park town |
40% |
|
|
Garden town |
30% |
|
|
Mixed function |
20% |
|
|
Industrial facilities |
15% |
|
|
Centre |
30% |
|
|
Kesklinn (City Centre) |
Forest town |
50% |
|
Park town |
40% |
|
|
Garden town |
30% |
|
|
Mixed function |
15% |
|
|
Public facilities |
15% |
|
|
Industrial facilities |
15% |
|
|
Kristiine |
Public facilities |
20% |
|
Business and industrial facilities |
10% |
|
|
Apartment houses |
30% |
|
|
Multiple-family houses |
40% |
|
|
Mixed function |
20% |
|
|
Business facilities |
15% |
|
|
Lasnamäe residential areas |
Public facilities |
20% |
|
Public facilities and apartment houses |
40% |
|
|
Business facilities |
20% |
|
|
Business facilities and apartment houses |
20% |
|
|
Business and industrial facilities |
15% |
|
|
Mixed function |
20% |
|
|
Apartment houses |
40% |
|
|
Apartment houses and business facilities |
30% |
|
|
Lasnamäe industrial areas |
Business facilities |
15% |
|
Business and industrial facilities |
15% |
|
|
Business, industrial facilities and apartment houses |
15% |
|
|
Apartment houses and business facilities |
20% |
|
|
Single-family houses |
40% |
|
|
Mustamäe |
Multiple-family houses |
40% |
|
Apartment houses |
40% |
|
|
Apartment houses with open space between houses |
40% |
|
|
Mixed function |
20% |
|
|
Public facilities |
20% |
|
|
Business facilities |
15% |
|
|
Special facilities |
15% |
|
|
Health facilities |
10% |
|
|
Apartment houses and public facilities |
15% |
|
|
Apartment houses and business facilities |
10% |
|
|
Public and business facilities |
10% |
|
|
Industrial and/or business facilities |
10% |
|
|
Multiple-family houses and business facilities |
10% |
|
|
Centre |
10% |
|
|
Nõmme |
Public areas |
50% |
|
Business and industrial facilities |
15% |
|
|
Apartment houses |
40% or 50% |
|
|
Apartment houses and business facilities |
40% |
|
|
Single-family houses |
50% |
|
|
Multiple-family houses |
50% |
|
|
Multiple-family houses and business facilities |
40% |
|
|
Mixed function |
20% |
|
|
Pirita |
Mixed function |
15% |
|
Existing single-family houses |
75% |
|
|
Multiple-family houses |
75% |
|
|
Apartment houses |
15% |
|
|
Perspective single-family houses |
70% |
|
|
Multiple-family houses with trees |
85% |
|
|
Public facilities |
15% |
|
|
Business facilities |
15% |
|
|
Industrial facilities |
10% |
|
|
Technological facilities |
will not change |
|
|
Põhja-Tallinn (North-Tallinn) |
Public facilities |
40% |
|
Business facilities |
15% or 20% |
|
|
Apartment houses |
30% or 40% |
|
|
Single-family houses |
40% |
|
|
Technological facilities |
15% |
|
|
Mixed function |
20% |
|
|
Industrial areas |
15% |
|
|
All districts |
Green areas |
Same as nowadays |
|
Transportation areas |
Same as nowadays |
Based on the greenery ratios set in district comprehensive plans, the future soil permeability
Table 3. Future soil permeability in Tallinn districts
|
District |
Area (ha)/ Permeabilty cover class, percentage |
||||
|
Class 0: 0-10% |
Class 1: 11-40% |
Class 2: 41-70% |
Class 3: 71-100% |
Total |
|
|
Haabersti |
0 |
1083 |
239 |
734 |
2056 |
|
Kesklinn |
68 |
873 |
181 |
1013 |
2135 |
|
Kristiine |
107 |
465 |
174 |
15 |
760 |
|
Lasnamäe |
4 |
1480 |
445 |
795 |
2724 |
|
Mustamäe |
202 |
356 |
136 |
107 |
801 |
|
Nõmme |
0 |
327 |
1252 |
1182 |
2761 |
|
Pirita |
10 |
173 |
197 |
1451 |
1831 |
|
Põhja-Tallinn |
3 |
931 |
146 |
376 |
1456 |
|
Total |
226 |
2160 |
3828 |
8310 |
14524 |
If the greenery ratios proposed in the district comprehensive plans would be implemented to the full extent (Table 2), the surface permeability would decrease (Table 3). The most significant reduction would be in Class 3: from 52% to 20% and in Class 1, where the number of polygons with greenery ration between 11 and 40% will almost equally increase (Table 4).
Table 4. Surface permeability classes today and in the future in Tallinn
|
Surface permeability class |
No of polygons today |
No of polygons in the future |
|
Class 0: 0-10 |
103, 4 |
58, 2 |
|
Class 1: 11-40 |
395, 15 |
1437, 54 |
|
Class 2: 41-70 |
779, 29 |
636, 24 |
|
Class 3: 71-100 |
1376, 52 |
522, 20 |
|
2653, 100 |
||
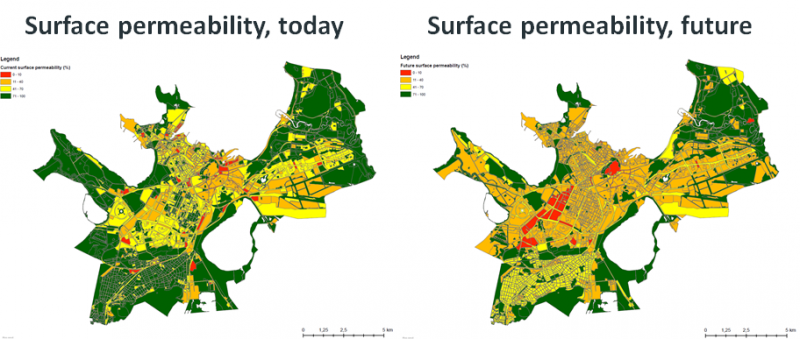
Map 2: Surface permeability in Tallinn today (left) and in the future (right), if the comprehensive plans would all be put into action.
The comparison between the contemporary and future permeability map indicates that the number on polygons in the lowest permeability class (Class 0) will decrease (from 4% to 2%), which seems a positive development (Table 3 and 4; Fig.2., map on the right), alluding that the worst areas of surface permeability will improve. However, the number of polygons in Classes 2 and 3 will also decrease and most of the polygons (54%) will fall into Class 1, having the second lowest permeability ratio (between 11% and 40%) of the polygons (Table 4). Today, 52% of the polygons are in good permeability condition (Class 3: 71-100% of permeability).
While looking at the future surface permeability scenario across districts, 5 districts out of 8 would experience rather significant reduction in surface permeability if the proposed greenery ratios in comprehensive plans would be strictly followed (Table 5). The most pronounced changes may take place in Haabersti district, since the number of polygons in Class 0 and 1 (the least surface permeability) could increase by 10-fold compared to the contemporary situation (from 5,4% to 54,9%). Also Kristiine, Lasnamäe, Mustamäe and Põhja-Tallinn may experience significant surface permeability reduction resulting from greenery ratio reduction in polygons, but at different scales. The least changes in the future compared to today’s situation would occur in Nõmme, Pirita and Kesklinn, where the greenery ratio has already been set high in comprehensive plan. For example, in Nõmme the suggested greenery ratio ranges from 40 to 50% and in Pirita even as high up to 75-85%. While the greenery ratio in Kesklinn (City Centre) has not been set particularly high, ranging from 15 to 40%, and in city forests up to 50%, the future scenario would not considerably differ from the today’s situation. One of the reasons may be the fact that the land use in City Centre has already taken shape and the objective is to maintain the green areas rather than to reduce them.
However, in five districts the surface permeability in Tallinn could decrease significantly, if the district comprehensive plans become fully implemented.
Table 5. Possible future surface permeability in districts and per permeability class
|
District |
No on polygons\ Permeability cover class |
Total |
|||
|
Class 0: 0-10% |
Class 1: 11-40% |
Class 2: 41-70% |
Class 3: 71-100% |
||
|
Haabersti |
0 |
101 |
18 |
66 |
185 |
|
Kesklinn |
8 |
168 |
23 |
43 |
242 |
|
Kristiine |
20 |
274 |
4 |
12 |
310 |
|
Lasnamäe |
2 |
206 |
14 |
61 |
283 |
|
Mustamäe |
22 |
81 |
5 |
17 |
125 |
|
Nõmme |
1 |
125 |
544 |
105 |
775 |
|
Pirita |
1 |
66 |
16 |
136 |
219 |
|
Põhja-Tallinn |
4 |
416 |
12 |
82 |
514 |
|
Total: % |
58 2.2% |
1437 54.2% |
636 24.0% |
522 19.7% |
2653 100% |
Canopy cover
Canopy cover percentage (also canopy overlay) is regarded as one of the indicators of urban climate resilience. Canopy cover plays an important role in reducing high temperature (heat wave) impacts on citizens and slows down the stormwater runoff by allowing more retention time to either infiltration of the water into the soil or flowing into stormwater collectors, and by that reducing the risk of flooding.
Canopy cover (overlay) in Tallinn
In this study, the tree canopy cover is expressed as the percentage of the ground area shaded by tree canopies relative to the total open area. No quality criteria were applied.
Only the contemporary situation was analysed in this study. The possible future canopy cover ratios in polygons depend on the implementation of the district comprehensive plans (if the greenery ratios proposed in these plans are strictly followed) and on the potential increase of construction pressure and associated tree cover loss. On the other hand, tree cover ratio may increase in some polygons that are currently brownfields with some greenery. If those underdeveloped areas are left aside for decades the tree canopy cover percentage may improve naturally. All these assumptions need additional analysis.
The following results were obtained.
Contemporary canopy cover
Base map: LiDAR-based vegetation elevation model of Tallinn.
Methodology: The vegetation elevation model contains 10x10 m cells with information of vegetation height in each cell. Cells where the vegetation height was between 5 and 30 m were extracted from the model. Cells with lower vegetation height were discarded because either they do not indicate trees or the trees are too small to offer proper ecosystem services. Cells with higher vegetation height were discarded because they contain more likely classification errors.
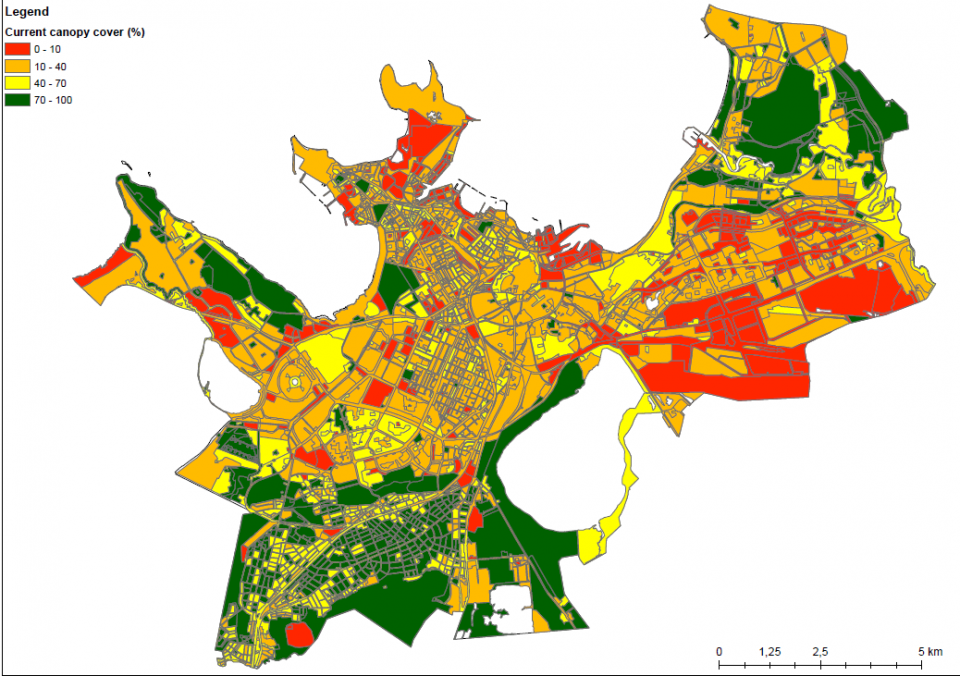
Percentage of canopy cover of each map polygon was calculated. The percentages were classified into four classes: Class 0: 0-10%, Class 1: 11-40%, Class 2: 41-70% and Class 3: 71-100%. The colours of the classes are represented on the map (Map.3.).

Map 3: Current canopy cover in Tallinn, percentage classes
Table 5. Contemporary canopy cover in Tallinn districts, no of polygons per canopy cover class
|
District |
No on polygons\ Canopy cover class |
Total |
|||
|
Class 0: 0-10% |
Class 1: 11-40% |
Class 2: 41-70% |
Class 3: 71-100% |
||
|
Haabersti |
31 |
60 |
40 |
54 |
185 |
|
Kesklinn |
35 |
127 |
60 |
20 |
242 |
|
Kristiine |
25 |
194 |
79 |
12 |
310 |
|
Lasnamäe |
114 |
135 |
29 |
5 |
283 |
|
Mustamäe |
21 |
62 |
31 |
11 |
125 |
|
Nõmme |
10 |
123 |
287 |
355 |
775 |
|
Pirita |
7 |
75 |
56 |
81 |
219 |
|
Põhja-Tallinn |
93 |
245 |
150 |
26 |
514 |
|
Total: % |
336 12,7% |
1021 38,5% |
732 27,6% |
564 21,3% |
2653 100% |
As described in Table 5, there are big differences between the Tallinn districts in canopy cover classes. The largest contemporary canopy cover among the Tallinn districts is in Nõmme, where 87% of Class 2 and 3 polygons are located, whereas Lasnamäe holds 2,6% of Class 2 and 3 polygons only.
Since the canopy cover and surface permeability depend on the greenery ratio, it is crucial for the city planners to maintain the ratio of greenery at current level since it provides good prerequisites for climate resilience. Any reduction would lead to the reduced climate resilience and associated wellbeing of citizens.
Access to public green areas
Access to public green areas has been regarded as essential for quality of life and wellbeing of local residents. Local authorities have an important role to ensure the public access to green areas via planning process.
Access to public green areas in 250m distance in Tallinn
In the current study, firstly, the availability of green areas of at least 0,75 ha (7500 m2) in size, secondly, the population in 100x100 m cells and thirdly, the number of residents living within 250 m radius of the green areas was mapped.
The following steps were taken.
Base map: Thematic plan of public green areas and a map of inhabitants in 100x100m cells.
Green public areas are green areas for public use. It should also be noted that Tallinn City has green areas of private use (e.g. relatively large private gardens in the districts of Pirita, Nõmme, Kristiine). Thus, the access to green areas describes only the accessibility of citizens to public green areas, while the accessibility to green areas is much better if private green areas are also taken into account. But, in this study, only public green areas are considered.
Methodology: The map of inhabitants in Tallinn consists of 100x100 m quadrate cells with population data. As of 1 January 2018 there were 427 201 inhabitants in Tallinn.
The map of public green areas of Tallinn contains 197 polygons larger than 0.75 ha (Table 6; Fig.4.). 41% of the polygons are up to 2.5 ha large. The second size class (2.5-10 ha) covers 58 polygons (29%). There are also 23 polygons that cover more than 50 ha of public green areas. These are protected areas, such as Natura 2000 sites and water protection zones covered by forests.
Table 6. Number of polygons across size classes of public green areas in Tallinn
|
Area class of green area |
No of polygons |
|
Class 1: 0,75 – 2,5 ha |
80 |
|
Class 2: 2,5 - 10 ha |
58 |
|
Class 3: 10 - 50 ha |
36 |
|
Class 4: >50 ha |
23 |
|
Total: |
197 |
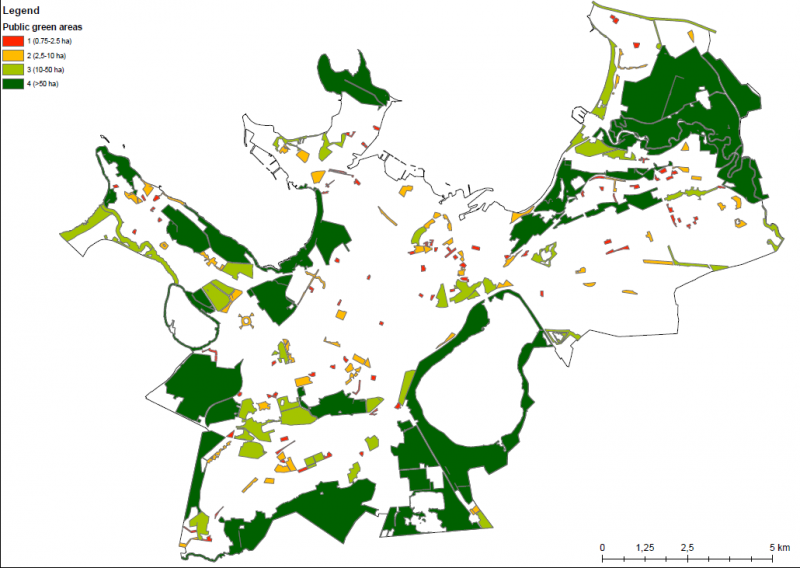 Map 4: Current access to public green areas in Tallinn, dependant on green area size class
There are 5490 by 100x100m cells across Tallinn city (Table 7). Population density in the city is rather low, since majority of the cells (65%) have less than 50 people. The population density is higher in districts with apartment houses, such as Mustamäe, Haabersti, Lasnamäe and North-Tallinn (Table 8; Map 5.).
Table 7. Citizens’ density in 100x100 m cells in Tallinn
|
Number of citizens classes |
Number of cells |
|
<= 50 |
3593 |
|
51-100 |
601 |
|
101-200 |
700 |
|
201-500 |
527 |
|
>=501 |
69 |
|
Total: |
5490 |
Map.5 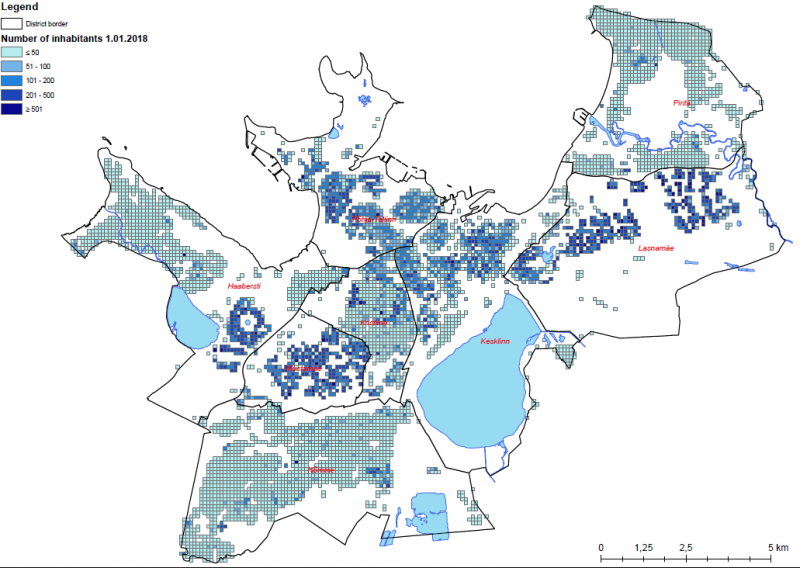
Map 5: Number of Tallinn citizens in cells (5 classes).
Table 8. Number of 100x100 m cells and number of citizens per population size class
|
No of 100x100 m cells per size class |
No of citizens per size class |
|||||||||||
|
Size class (no of citizens) District |
≤ 50 |
51–100 |
101–200 |
201–500 |
≥ 501 |
Total |
≤ 50 |
51–100 |
101–200 |
201–500 |
≥ 501 |
Total |
|
Haabersti |
645 |
40 |
57 |
61 |
6 |
809 |
9397 |
3023 |
8344 |
18839 |
3676 |
43279 |
|
Kesklinn |
305 |
144 |
148 |
65 |
1 |
663 |
5746 |
10786 |
20897 |
17018 |
2921 |
57368 |
|
Kristiine |
307 |
90 |
56 |
28 |
4 |
485 |
7150 |
6489 |
8007 |
7900 |
2731 |
32277 |
|
Lasnamäe |
77 |
56 |
111 |
177 |
47 |
468 |
1205 |
4332 |
16676 |
58510 |
34273 |
114996 |
|
Mustamäe |
34 |
33 |
111 |
124 |
8 |
310 |
409 |
2642 |
16720 |
38525 |
6806 |
65102 |
|
Nõmme |
1275 |
79 |
35 |
6 |
1 |
1396 |
25548 |
5422 |
4889 |
1995 |
1131 |
38985 |
|
Pirita |
831 |
30 |
10 |
3 |
0 |
874 |
13706 |
2200 |
1251 |
738 |
- |
17895 |
|
Põhja-Tallinn |
119 |
129 |
172 |
63 |
2 |
485 |
2432 |
9608 |
24112 |
17584 |
3563 |
57299 |
|
Total: |
3593 |
601 |
700 |
527 |
69 |
5490 |
65593 |
44502 |
100896 |
161109 |
55101 |
427201 |
Table 9. Access to public green areas by citizens in districts, up to 250 m and further distance
|
District |
No of citizens in districts |
% of citizens living in 250 m radius of a public green area |
% of citizens living further than 250 m radius of a public green area |
|
Haabersti |
43279 |
77.6 |
22.4 |
|
Kesklinn |
57368 |
87.9 |
12.1 |
|
Kristiine |
32277 |
44.9 |
55.1 |
|
Lasnamäe |
114996 |
81.7 |
18.3 |
|
Mustamäe |
65102 |
71.3 |
28.7 |
|
Nõmme |
38985 |
82.7 |
17.3 |
|
Pirita |
17895 |
97.3 |
2.7 |
|
Põhja-Tallinn |
57299 |
85.6 |
14.4 |
|
Total: |
427 201 |
79.0% |
21.0% |
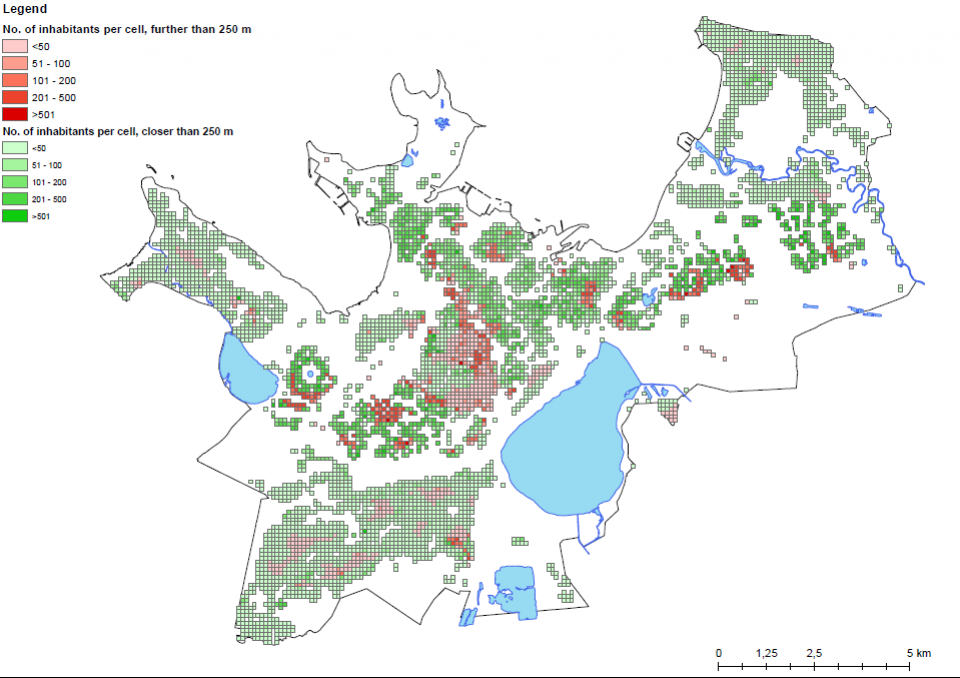
A 250 m buffer was constructed around the public green areas and population cells were differentiated based on whether their centroid was inside or outside of the buffer. According to the analysis, 79% of the population of Tallinn lives in a distance of 250 m or less to a public green area with at least 0.75 ha size (Table 9-11; Fig.6.). The best access to public green areas appears to be in districts of Pirita, Kesklinn and Põhja-Tallinn, where 85 to 97% of the people in these districts have access to a public green area closer than 250 m. The district of Lasnamäe outstands the other districts, since the citizens have the least access to a public green area in their closest vicinity: 55% of the district population have access to a public green area further than 250 m of home (Table 10).
Table 10. Access to public green areas by citizens
|
Cell class of the number of citizens |
Number of cells, hosting public green areas closer than 250 m |
|
<=50 |
3108 |
|
51-100 |
484 |
|
101-200 |
550 |
|
201-500 |
400 |
|
>=500 |
62 |
|
Cell class of the number of citizens |
Number of cells, hosting public green areas further than 250 m |
|
<=50 |
485 |
|
51-100 |
117 |
|
101-200 |
150 |
|
201-500 |
127 |
|
>=501 |
7 |

Map 6: Access to public green areas closer and farther than 250 m in Tallinn.
Table 11. Citizens’ distance from public green areas in districts
|
No of citizens in cells less than 250 m from nearest public green areas |
No of citizens in cells further than 250 m from nearest public green areas |
|||||||||||
|
Size class (no of citizens) District |
≤ 50 |
51–100 |
101–200 |
201–500 |
≥ 501 |
Total |
≤ 50 |
51–100 |
101–200 |
201–500 |
≥ 501 |
Total |
|
Haabersti |
8484 |
2395 |
6051 |
12972 |
3676 |
33578 |
913 |
628 |
2293 |
5867 |
0 |
9701 |
|
Kesklinn |
4927 |
9751 |
18189 |
14636 |
2921 |
50424 |
819 |
1035 |
2708 |
2382 |
0 |
6944 |
|
Kristiine |
3085 |
2647 |
3155 |
3933 |
1661 |
14481 |
4065 |
3842 |
4852 |
3967 |
1070 |
17796 |
|
Lasnamäe |
979 |
3512 |
13650 |
47665 |
28102 |
93908 |
226 |
820 |
3026 |
10845 |
6171 |
21088 |
|
Mustamäe |
296 |
1964 |
12768 |
27557 |
3854 |
46439 |
113 |
678 |
3952 |
10968 |
2952 |
18663 |
|
Nõmme |
21622 |
4756 |
3717 |
1017 |
1131 |
32243 |
3926 |
666 |
1172 |
978 |
0 |
6742 |
|
Pirita |
13224 |
2200 |
1251 |
738 |
0 |
17413 |
482 |
0 |
0 |
0 |
0 |
482 |
|
Põhja-Tallinn |
2228 |
8664 |
20440 |
14157 |
3563 |
49052 |
204 |
944 |
3672 |
3427 |
0 |
8247 |
|
Total: |
54845 |
35889 |
79221 |
122675 |
44908 |
337538 79.0% of total Tallinn population |
10748 |
8613 |
21675 |
38434 |
10193 |
89663 21% of total Tallinn population |
In conclusion, the study results demonstrate that majority of the residents of Tallinn city (about 80%) has a rather good access to public green areas (of at least 7500 m2 large) in their closest vicinity of 250 m. In addition to the access to public green areas also privately owned gardens in the districts of Kristiine, Nõmme and Pirita play an important role in providing recreational and climate resilience services to the citizens.
The study results demonstrate that:
- The Tallinn city has a good availability of green areas for public use: 79% of residents have an access to public green area in their closest vicinity of 250 m;
- The climate resilience of Tallinn city in terms of surface permeability and canopy cover needs to be maintained. However, if the greenery ratios set in district comprehensive plans are followed and implemented, there is a danger to reduce the climate resilience of the city;
- Thus, the district comprehensive plans need an urgent critical review from the point of climate resilience.
The study results demonstrate that for maintaining the climate resilience of Tallinn city, a critical review of the district comprehensive plans is urgently needed. Otherwise the city loses its climate resilience.
Further information
The study approach was an exploratory one, since there were very little previous studies to take advantage of. The current study experimented with the scales of surface permeability and canopy cover. The classes were suggested as the best expert opinion. Also the approach to assess the access to public green areas in combination with population densities in 100x100m cells was experimental. No previous studies to compare the current results with are available.